Data Analysis For PeopleWho Hate Spreadsheets
AI that understands your business data and finds connections you didn't know existed
What if AI actually understood your business context and was able to get you the answers you need fast, correct, and validated the first time?
MIRA doesn't just pull the numbers. It tells you what they mean.
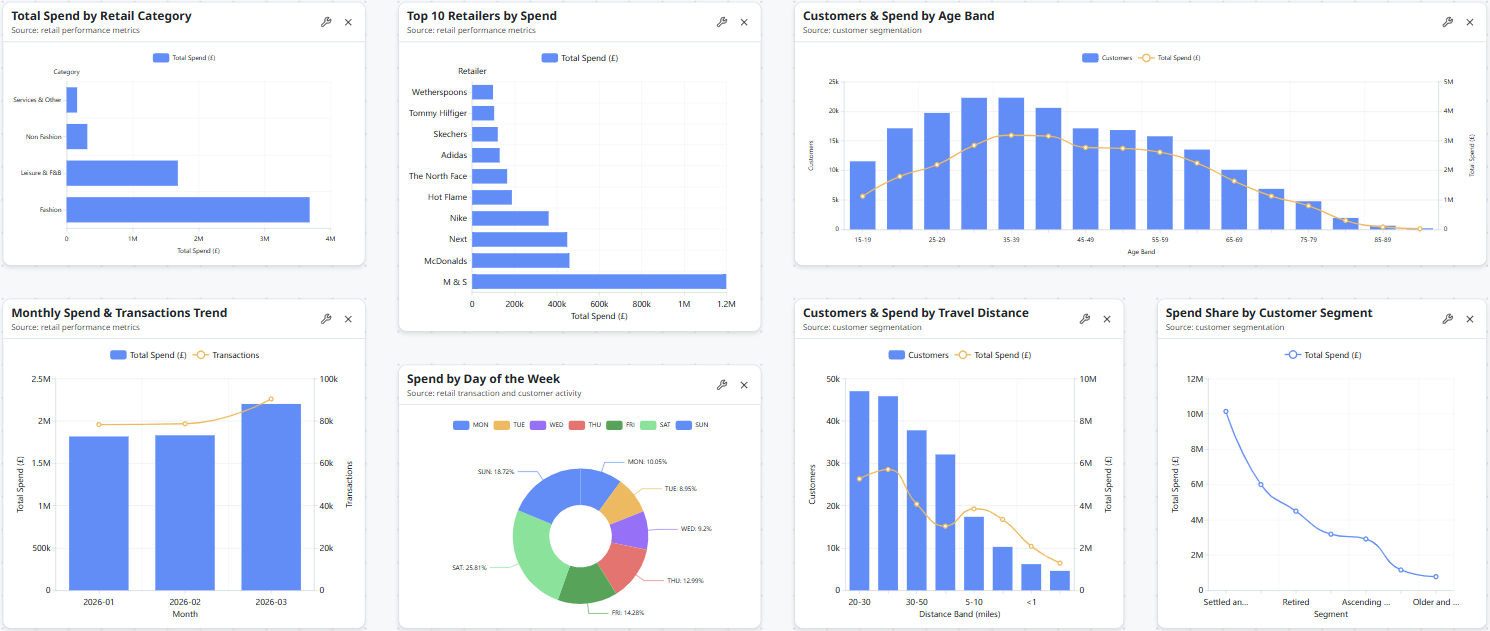
Ask a question in plain English, get back a full analysis — visualizations, written conclusions, the works. Like having a data analyst on call.
Your data, on autopilot
MIRA builds a living picture of your business that updates as you do — no re-uploading, no stale reports, no Sunday evening data admin.
Your tools, your data, all in one place
MIRA connects to the platforms your business already runs on, so your analysis always has the full picture.
- Connect CRMs, databases, spreadsheets & more
- New integrations added every sprint
- No data leaves your environment
- Works with whatever you already use
Accurate answers. Protected data. Total transparency.
MIRA is built for businesses that can't afford to get it wrong and designed to prove it at every step.
Connected to workspace and indexed all available data sources. Identified 3 queryable domains across the organization.
Domains Discovered
- Technology Related Grants4 tables
- Commercialization Related Grants3 tables
- Basic Science Related Grants2 tables
Matched query intent to the “Basic Science Related Grants” domain. Inspected table schemas and detected join relationships.
Selected Domain
Tables Found
- SCI_DATA_SCI8,628 rows
- SCI_DATA_SCI_Companies55 rows
Generated and executed SQL against matched tables. Aggregated funding by organization and returned the top 10 recipients.
Generated Query
SELECT org_name,
       COUNT(*) AS grants,
       SUM(award_amt) AS total_funding
FROM   SCI_DATA_SCI
WHERE  fiscal_year >= 2023
GROUP  BY org_name
ORDER  BY total_funding DESC
LIMIT  10;
Execution
Mapped query results to a visualization. Selected chart type based on data shape and aggregation pattern.
Visualization Config
Source Query
SELECT org_name,
       SUM(award_amt) AS total_funding
FROM   SCI_DATA_SCI
WHERE  fiscal_year >= 2023
GROUP  BY org_name
ORDER  BY total_funding DESC
LIMIT 10;In Q3 2024, closed-won revenue reached $38.4M1Citation 1TablesSALES_PIPELINECRM_OPPORTUNITIESQueriesSUM(deal_value) WHERE stage = 'closed_won' AND quarter = 'Q3_2024'COUNT(*) GROUP BY rep_id WHERE closed_won = trueAVG(days_to_close) WHERE stage = 'closed_won' — a 22% year-over-year increase2Citation 2TablesSALES_PIPELINESALES_PIPELINE_ARCHIVEQUOTA_TARGETSQuery(SUM(deal_value) WHERE quarter = 'Q3_2024') / (SUM(deal_value) WHERE quarter = 'Q3_2023') - 1. Enterprise accounts drove 67% of total bookings3Citation 3TableCRM_ACCOUNTSQueriesSUM(deal_value) WHERE segment = 'enterprise' AND quarter = 'Q3_2024'SUM(deal_value) WHERE quarter = 'Q3_2024' despite representing only 12% of active deals. Average deal size for enterprise deals was $214K4Citation 4TablesSALES_PIPELINEPRODUCT_CATALOGCRM_OPPORTUNITIESQueriesAVG(deal_value) WHERE product_tier = 'enterprise'AVG(deal_value) WHERE product_tier = 'mid_market' — 4.8× the mid-market average — with a median sales cycle of 47 days5Citation 5TablesSALES_PIPELINEACTIVITY_LOGQueriesMEDIAN(days_to_close) WHERE segment = 'enterprise' AND stage = 'closed_won'PERCENTILE(days_to_close, 0.75) WHERE segment = 'enterprise' from first touch to signature.
Every answer,
verified.
MIRA layers multiple verification systems across every response — so every figure can be traced to its source, cited from the raw data, and validated on demand.
MIRA records a full lineage at every stage of reasoning — from domain selection through query execution to visualization. Every step is timestamped and linked end-to-end, so you can always rewind, double-check any decision, and know exactly how your answer was built.
Each reasoning step is captured as a structured tool call — tables accessed, SQL generated, rows returned, visualization parameters set. Expand any step to see the complete execution trace and verify exactly where MIRA pulled its data from.
Every figure in a MIRA response carries an inline citation. Click any superscript number to instantly see the exact tables queried and the SQL behind it — no guessing, no black boxes, just full source transparency.
Hit Validate on any citation and MIRA re-runs the source query directly against your live data, compares it to the reported figure, and flags any discrepancy — giving you a one-click audit trail for every number in the response.
Scale with security.
Enterprise-grade infrastructure that keeps your data in your environment, fully audited, and always available — at any scale.
Frequently Asked Questions
Find answers to common questions about MIRA.
No. MIRA is built for business users, not data analysts. Ask questions in plain English and get instant answers with visualizations. No SQL, no coding, no technical expertise required.
MIRA never reads or stores your raw data. All processing happens within your secure environment, and we use enterprise-grade encryption for data in transit. You maintain complete control over who can access what data, and you can revoke access at any time.
No. MIRA never trains or retains any information from your data without your permission. Your data is not used to train AI in any way, ever. MIRA only retains information that you explicitly share within the scope of your organization to improve your specific experience.
We are constantly adding new integrations. If you need a specific connection not listed here, please reach out to us via email at hello@searchmira.com.
Every answer includes the SQL query and raw data behind it, so you can verify accuracy. If something's wrong, you can provide feedback and MIRA learns from it. Transparency is built in.
Yes! We offer a free trial with 3 file uploads. You can explore the platform, connect your data sources, and create dashboards to see if MIRA is right for your needs.
Yes, we offer custom enterprise plans for larger organizations with specific needs, including dedicated support, custom integrations, and SLA guarantees.